Mean Median Mode Calculator
Enter your numbers below and get the mean, median, mode, range, and more, instantly.
Separate numbers with commas, spaces, or line breaks. Decimals and negative numbers are fine.
Three questions sit at the heart of basic statistics: what is the average, what sits in the middle, and what shows up most often. This guide explains each measure with formulas and verified examples.
A free mean median mode calculator computes the three main measures of central tendency for any data set you enter. The mean is the total of all values divided by the count. The median is the middle value once the data is sorted. The mode is the value that appears most often. Use it for homework, grades, or survey results.
How to Use the Mean Median Mode Calculator
- Type your numbers into the calculator box. Separate each value with a comma, a space, or a line break.
- Decimals and negative numbers are accepted, so test scores, temperatures, and prices all work.
- Press Calculate. The tool sorts your data and reports the mean, median, mode, range, count, sum, minimum, and maximum.
- Check the sorted-data line to confirm your input.
- Press Clear to empty the box and start a new data set.
If you see an error message, look for letters or stray symbols in your input.
What Is the Mean of a Data Set?
The mean is the familiar arithmetic average: add every value together, then divide by how many values there are.
Take 2, 4, 4, 6, 8, 10. The sum is 34 and the count is 6, so the mean is 34 / 6 = 5.6667. The mean is the best single-number summary for roughly symmetrical data with no extreme outliers. Students averaging their grades with a GPA calculator are doing the same operation: adding up grade points and dividing by the number of courses.
What Is the Median of a Data Set?
The median is the middle value when the data is arranged from smallest to largest. Sort first, then look at the center.
With an even count, average the two middle values: for 10, 20, 30, 40 the median is (20 + 30) / 2 = 25.
The median is the safer summary when outliers could distort the mean: one mansion pulls the mean price up, but the median still reflects what a typical house costs.
What Is the Mode of a Data Set?
The mode is the value that appears most often. In 2, 4, 4, 6, 8, 10, the number 4 occurs twice while every other value occurs once, so the mode is 4. Some data sets have no mode, as in 1, 2, 3, 4, 5 where every value appears once. Others have more than one: in 3, 3, 5, 5, 7 both 3 and 5 appear twice, so the data is bimodal. The mode is also the only measure that works with categories, such as the most common shoe size in a class.
Mean Median Mode Calculator: Worked Examples
Verified results for five data sets:
| Data set | Mean | Median | Mode | Range |
|---|---|---|---|---|
| 2, 4, 4, 6, 8, 10 | 5.6667 | 5 | 4 | 8 |
| 1, 2, 3, 4, 5 | 3 | 3 | No mode | 4 |
| 3, 3, 5, 5, 7 | 4.6 | 5 | 3, 5 | 4 |
| 10, 20, 30, 40 | 25 | 25 | No mode | 30 |
| 1.5, 2.5, 2.5, 3.75 | 2.5625 | 2.5 | 2.5 | 2.25 |
Decimal inputs give decimal answers, such as the mean of 5.6667 in the first row. If you ever need to switch a fraction into a decimal, a fraction to decimal calculator handles it in one step.
Mean vs. Median vs. Mode: Which One Should You Use?
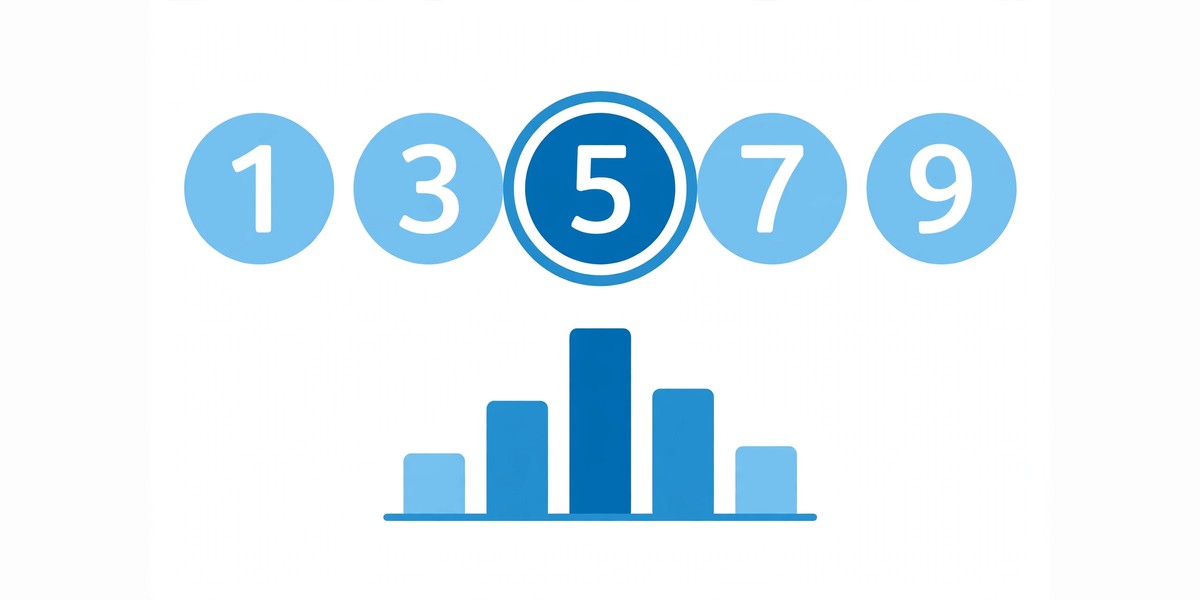
Each measure answers a different question. The mean answers "what is the typical value if everything were shared equally." The median answers "what is the value in the exact middle." The mode answers "what is the most common value." When data is skewed, the mean and median disagree, and the gap is informative: salaries at a company with one highly paid executive show a mean well above the median, because the median ignores the outlier while the mean is pulled up by it. For symmetrical data, all three sit close together.
- Use the mean for symmetrical numeric data, such as repeated measurements of the same quantity.
- Use the median for skewed data with outliers, such as incomes, house prices, or waiting times.
- Use the mode when the most popular value matters, such as the best-selling shirt size.
When you compare two groups, measure both the same way, then express the difference in context. A ratio calculator is handy when you want to compare data sets proportionally, for example one group's average expressed as a fraction of another group's average.
Frequently Asked Questions
How do I calculate the mean, median, and mode?
Enter your numbers into the mean median mode calculator above, separated by commas, spaces, or line breaks, and press Calculate. By hand, add the values and divide by the count for the mean, sort and take the middle value for the median, and count frequencies for the mode.
What happens when there is no mode in the data set?
The calculator simply reports "No mode." This happens when every value appears the same number of times, as in 1, 2, 3, 4, 5. It is a normal result: the mean and median still describe the data well.
Can a data set have more than one mode?
Two values tied for the highest frequency make the data bimodal; three tied values make it trimodal. The calculator lists every mode, smallest first. For example, 3, 3, 5, 5, 7 has the modes 3 and 5.
Is the mean always higher than the median?
No. In right-skewed data, like income distributions, large outliers pull the mean above the median. In left-skewed data the mean can sit below it. In symmetrical data, the two are usually equal or very close.
How many numbers do I need for a meaningful average?
Two or more values can be averaged, but the mean grows more stable as the data set grows. With a small sample, one outlier can move the mean a lot, so the median is often the better summary.
What is the difference between mean and median?
The mean is the arithmetic average: the sum divided by the count. The median is the middle value of the sorted data, and because it only cares about position, it resists outliers.